Multiple Choice
Use the figure below to answer the following questions.
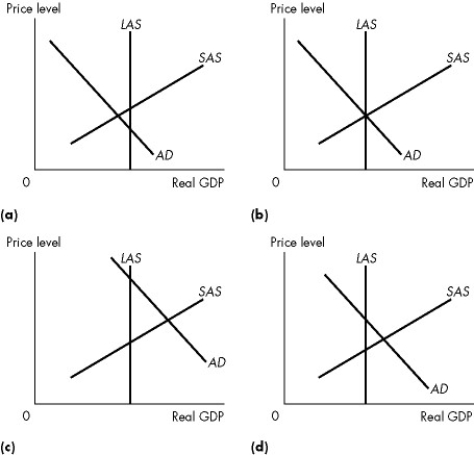
Figure 26.3.3
-Refer to Figure 26.3.3. In which of the graphs would we predict that eventually the price level will fall and real GDP will decrease, all else remaining the same?
A) (a)
B) (b)
C) (c)
D) (d)
E) none of the graphs
Correct Answer:

Verified
Correct Answer:
Verified
Q21: If real GDP is less than potential
Q22: Use the figure below to answer the
Q23: Long-run aggregate supply will increase for all
Q24: Use the figure below to answer the
Q25: Consider an economy starting from a position
Q27: Potential GDP<br>A)increases as the price level rises.<br>B)is
Q28: Canadian firms build new pipelines across the
Q29: Which of the following situations illustrates how
Q30: The long-run aggregate supply curve is<br>A)vertical.<br>B)negatively sloped.<br>C)positively
Q31: Which one of the following newspaper quotations