Multiple Choice
Use the figure below to answer the following questions.
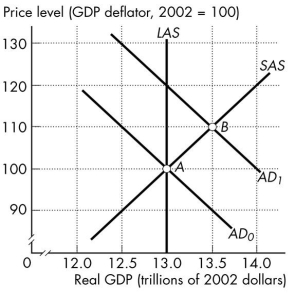
Figure 26.3.5
-Refer to Figure 26.3.5. If the aggregate demand curve is AD₂, real GDP is
A) $13 trillion.
B) $13.5 trillion.
C) more than $13 trillion and less than $13.5 trillion.
D) less than $13 trillion.
E) 100
Correct Answer:

Verified
Correct Answer:
Verified
Q19: Use the figure below to answer the
Q20: We observe a decrease in the price
Q21: If real GDP is less than potential
Q22: Use the figure below to answer the
Q23: Long-run aggregate supply will increase for all
Q25: Consider an economy starting from a position
Q26: Use the figure below to answer the
Q27: Potential GDP<br>A)increases as the price level rises.<br>B)is
Q28: Canadian firms build new pipelines across the
Q29: Which of the following situations illustrates how