Multiple Choice
Use the figure below to answer the following question.
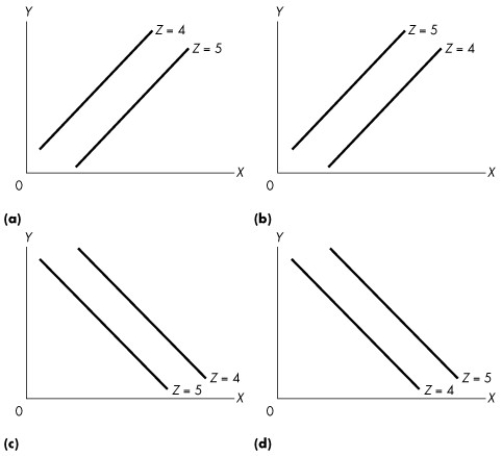
Figure 1A.4.1
-Given the data in the following table, which one of the graphs in Figure 1A.4.1 correctly represents the relationship among x, y, and z? 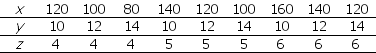
A) (a)
B) (b)
C) (c)
D) (d)
E) (b) and (c)
Correct Answer:

Verified
Correct Answer:
Verified
Related Questions
Q16: Use the table below to answer the
Q30: The study of how wages are set
Q66: Use the figure below to answer the
Q72: An incentive<br>A)could be a reward but could
Q89: The slope of a straight line<br>A)is the
Q108: The inescapable economic fact is that<br>A)there are
Q120: Given the data in Table 1A.4.2,holding price
Q185: Use the figure below to answer the
Q191: To earn income,people sell the services of
Q206: The concept of opportunity cost<br>A)is relevant only