Multiple Choice
Use the figure below to answer the following question.
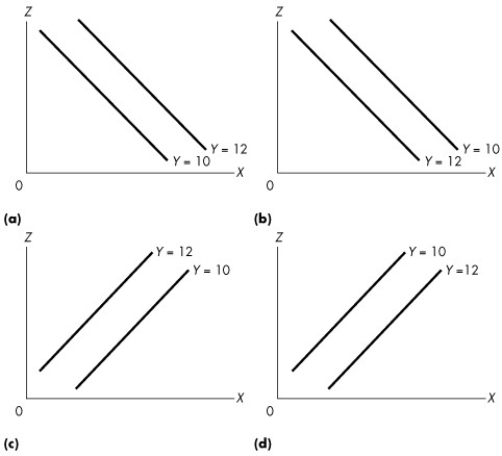
Figure 1A.4.2
-Given the data in the following table, which one of the graphs in Figure 1A.4.2 correctly represents the relationship among x, y, and z? 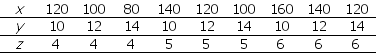
A) (a)
B) (b)
C) (c)
D) (d)
E) (a) and (d)
Correct Answer:

Verified
Correct Answer:
Verified
Q2: When a firm decides to produce computers
Q9: "The rich should face higher income tax
Q42: Use the table below to answer the
Q72: An incentive<br>A)could be a reward but could
Q81: Use the figure below to answer the
Q101: Use the figure below to answer the
Q109: Use the figure below to answer the
Q137: A positive statement is<br>A)always true.<br>B)always false.<br>C)about what
Q163: Two variables are negatively related if<br>A)increases in
Q167: To disentangle cause and effect, economists use