Multiple Choice
Use the figure below to answer the following questions.
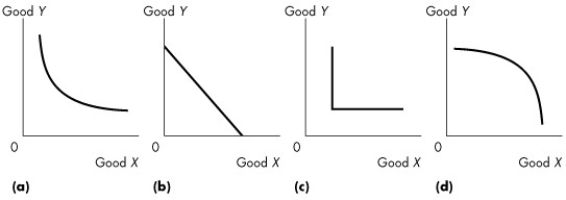
Figure 9.2.1
-Which of the graphs in Figure 9.2.1 shows perfect substitutes?
A) (a)
B) (b)
C) (c)
D) (d)
E) (c) and (d)
Correct Answer:

Verified
Correct Answer:
Verified
Related Questions
Q34: Use the figure below to answer the
Q47: For a normal good,the income effect<br>A)is negative
Q50: Use the figure below to answer the
Q66: If two consumption points are on different
Q74: Which of the following is not relevant
Q75: Which statement is true for a normal
Q83: Moving down along a given budget line,real
Q110: A preference map is<br>A)a series of points
Q112: Larry consumes only beer (B)and chips (C).
Q115: Martha consumes cake and muffins.Suppose Martha's income