Multiple Choice
Use the figure below to answer the following question. 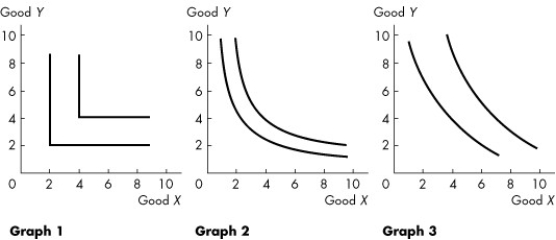 Figure 9.2.5
-Refer to Figure 9.2.5.The graphs show indifference curves for various goods.Graph ________ best describes the pair of goods baseballs and baseball bats.Graph ________ best describes the pair of goods desktop computers and laptop computers.
A) 2;3
B) 2;1
C) 1;1
D) 1;3
E) 3;2
Correct Answer:

Verified
Correct Answer:
Verified
Q47: For a normal good,the income effect<br>A)is negative
Q48: Larry consumes only beer (B)and chips (C).The
Q49: Peter's income increases and so does his
Q50: Use the figure below to answer the
Q51: Jay has an income of $10 to
Q53: Use the figure below to answer the
Q54: When Jim is at his best affordable
Q55: Karen consumes chocolate and candles.When Karen is
Q56: Use the figure below to answer the
Q57: Suppose all prices double and income also