Multiple Choice
Use the figure below to answer the following questions.
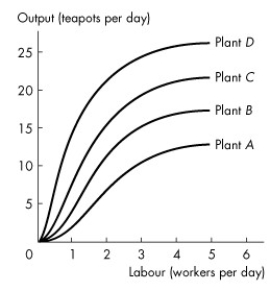
Figure 11.4.1
-Refer to Figure 11.4.1 which shows the total product curves for four different plant sizes as Tania varies the quantity of capital and workers. The curve that represents the plant using the largest amount of capital is
A) plant A.
B) plant B.
C) plant C.
D) plant D.
E) all curves because each plant uses the same number of machines, just different amounts of labour.
Correct Answer:

Verified
Correct Answer:
Verified
Q16: Table 11.2.1<br> <img src="https://d2lvgg3v3hfg70.cloudfront.net/TB3019/.jpg" alt="Table 11.2.1
Q17: Which of the following quotes best illustrates
Q22: If ATC is falling, then MC must
Q24: Use the information below to answer the
Q32: Marginal cost equals<br>A)Q/TVC.<br>B)ΔTFC/ΔTC.<br>C)ΔTC/ΔQ.<br>D)ΔQ/ΔTVC.<br>E)(TC - TVC)/Q.
Q44: When the 7th worker is hired,output increases
Q47: A firm experiences _ when its _
Q50: The MC curve shifts upward if<br>A)factor prices
Q75: The range over which average variable cost
Q121: The total output produced with any quantity