Multiple Choice
Use the figure below to answer the following questions.
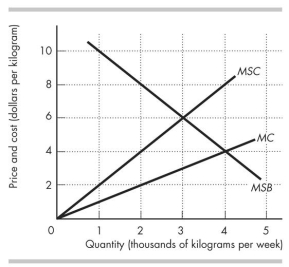
Figure 17.3.1
-Figure 17.3.1 shows the marginal private cost curve, marginal social cost curve, and marginal social benefit curve for cod, a common resource. The equilibrium quantity in an unregulated market is
A) 0 kilograms a week.
B) 4,000 kilograms a week.
C) 3,000 kilograms a week.
D) 5,000 kilograms a week.
E) 1,000 kilograms a week.
Correct Answer:

Verified
Correct Answer:
Verified
Q18: The budget of a government department is
Q30: The "tragedy of the commons" refers to<br>A)the
Q39: When a good is rival and excludable,it
Q43: The idea that the platforms of the
Q46: Public choice theory predicts that<br>A)voters are fully
Q53: When a good is nonrival and nonexcludable,it
Q65: Which of the following achieves the efficient
Q77: Setting a production quota does not always
Q80: Public choice theory assumes those involved in
Q87: A view of the sunset is<br>A)excludable and