Multiple Choice
Figure 1-1
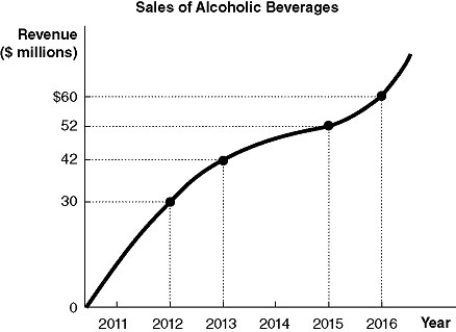
-Refer to Figure 1-1.Using the information in the figure above, calculate the percentage change in sales of alcoholic beverages between 2013 and 2016.
A) 23.1%
B) 23.8%
C) 30%
D) 42.9%
Correct Answer:

Verified
Correct Answer:
Verified
Q20: Pookie's Pinball Palace restores old Pinball machines.Pookie
Q69: If it costs Sinclair $300 to produce
Q78: Article Summary<br>Recent studies about wealth inequality and
Q82: Article Summary<br>Recent studies about wealth inequality and
Q107: One example of human capital is the
Q111: What is an economic variable?
Q117: Scarcity is a problem that will eventually
Q159: Which of the following generates productive efficiency?<br>A)competition
Q179: Pookie's Pinball Palace restores old Pinball machines.Pookie
Q192: All of the following are part of