Essay
Table 2-17
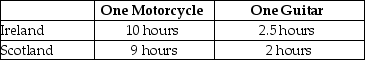
-Refer to Table 2-17.This table shows the number of labor hours required to produce a motorcycle and a guitar in Ireland and Scotland.
a.Assume each country has a total of 2,700 labor hours to devote to the production of the two goods and draw the production possibilities frontier for each country.Put "Motorcycle" on the horizontal axis and "Guitar" on the vertical axis.Be sure to identify the intercept values on your graphs.
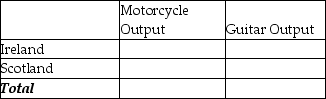
b.Suppose each country allocates 55% of its labor hours to guitar production and 45% to the production of motorcycles.Complete Table 2-18 below to show each country's output of the two products.
Table 2-18: Production and Consumption with no Trade
c.If the two countries do not trade and consume whatever they produce, identify the current production and consumption point for each country on their respective production possibilities frontiers.Label Ireland's consumption point "I" and Scotland's consumption point "S".
d.Suppose the two countries specialize and trade.Which country should produce motorcycles and which should produce guitars? Explain your answer.
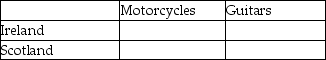
e.Complete Table 2-19 below to show each country's output with specialization.
Table 2-19: Output with Specialization

f.Did specialization increase the combined output for the two countries without any increase in resources? If so, by how much?
g.Suppose Ireland and Scotland agree to trade so that in exchange for 600 guitars, the exporter of guitars receives 140 motorcycles.Complete Table 2-20 below to show each country's consumption bundle after trade.
Table 2-20: Consumption with Trade
h.Show the consumption points after trade on each country's production possibilities frontier.Label these points "X" for Ireland and "Y" for Scotland.
i.Has trade made the two countries better off? Explain your answer.
Correct Answer:

Verified
a.  b.Table 2-18: Production and Consump...
View Answer
Unlock this answer now
Get Access to more Verified Answers free of charge
Correct Answer:
Verified
View Answer
Unlock this answer now
Get Access to more Verified Answers free of charge
Q39: Figure 2-10<br> <img src="https://d2lvgg3v3hfg70.cloudfront.net/TB4193/.jpg" alt="Figure 2-10
Q41: Table 2-10<br> <img src="https://d2lvgg3v3hfg70.cloudfront.net/TB4193/.jpg" alt="Table 2-10
Q113: Table 2-8<br> <img src="https://d2lvgg3v3hfg70.cloudfront.net/TB4193/.jpg" alt="Table 2-8
Q121: What is a circular flow diagram and
Q169: Figure 2-6<br> <img src="https://d2lvgg3v3hfg70.cloudfront.net/TB4192/.jpg" alt="Figure 2-6
Q188: Table 2-7<br> <img src="https://d2lvgg3v3hfg70.cloudfront.net/TB4193/.jpg" alt="Table 2-7
Q193: Table 2-16<br><img src="https://d2lvgg3v3hfg70.cloudfront.net/TB4193/.jpg" alt="Table 2-16
Q208: Figure 2-3<br> <img src="https://d2lvgg3v3hfg70.cloudfront.net/TB4193/.jpg" alt="Figure 2-3
Q225: What shape does a production possibilities frontier
Q230: The payment received by suppliers of entrepreneurial