Multiple Choice
Figure 3-8
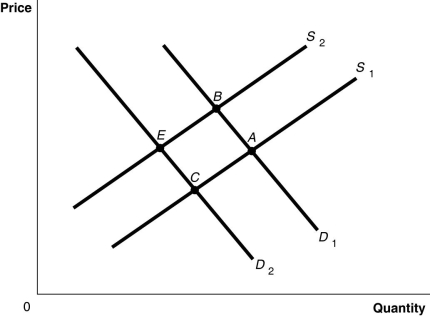
-Refer to Figure 3-8.The graph in this figure illustrates an initial competitive equilibrium in the market for apples at the intersection of D₂ and S₁ (point C) . Which of the following changes would cause the equilibrium to change to point B?
A) A positive change in the technology used to produce apples and decrease in the price of oranges, a substitute for apples.
B) An increase in the wages of apple workers and an increase in the price of oranges, a substitute for apples.
C) An increase in the number of apple producers and a decrease in the number of apple trees as a result of disease.
D) A decrease in the wages of apple workers and an increase in the price of oranges, a substitute for apples.
Correct Answer:

Verified
Correct Answer:
Verified
Q15: Suppose that in October, market analysts predict
Q42: At a product's equilibrium price<br>A)the product's demand
Q56: In each of the following situations, list
Q76: Which of the following would shift the
Q91: Table 3-1<br> <img src="https://d2lvgg3v3hfg70.cloudfront.net/TB4193/.jpg" alt="Table 3-1
Q115: Table 3-3<br> <img src="https://d2lvgg3v3hfg70.cloudfront.net/TB4193/.jpg" alt="Table 3-3
Q138: For each of the following pairs of
Q184: Assume there is a shortage in the
Q199: Prices of California Merlot wine (assume that
Q207: The income effect explains why there is