Multiple Choice
Figure 3-8
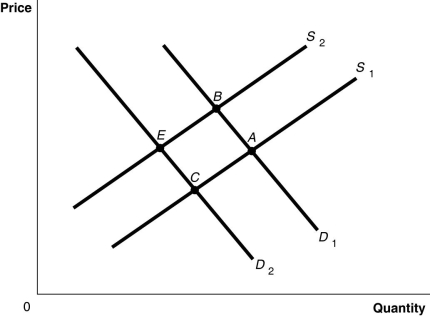
-Refer to Figure 3-8.The graph in this figure illustrates an initial competitive equilibrium in the market for apples at the intersection of D₁ and S₂ (point B) . Which of the following changes would cause the equilibrium to change to point C?
A) A positive change in the technology used to produce apples and decrease in the price of oranges, a substitute for apples.
B) An increase in the wages of apple workers and an increase in the price of oranges, a substitute for apples.
C) An increase in the number of apple producers and a decrease in the number of apple trees as a result of disease.
D) A decrease in the wages of apple workers and an increase in the price of oranges, a substitute for apples.
Correct Answer:

Verified
Correct Answer:
Verified
Q31: Let D = demand, S = supply,
Q68: If the demand for a product decreases
Q127: If a demand curve shifts to the
Q140: In February, market analysts predict that the
Q178: All else equal, the decrease in the
Q183: Suppose favorable weather resulted in a bumper
Q193: Figure 3-2<br> <img src="https://d2lvgg3v3hfg70.cloudfront.net/TB4193/.jpg" alt="Figure 3-2
Q201: If, for a product, the quantity supplied
Q221: Table 3-2<br> <img src="https://d2lvgg3v3hfg70.cloudfront.net/TB4193/.jpg" alt="Table 3-2
Q230: In 2004, hurricanes destroyed a large portion