Multiple Choice
Figure 5-13
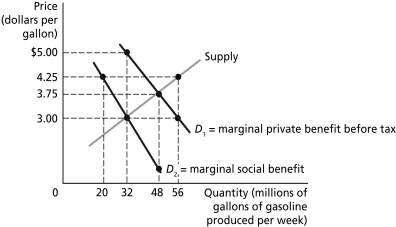
Figure 5-13 illustrates the market for gasoline before and after the government imposes a tax to bring about the efficient level of gasoline production.
-Refer to Figure 5-13.The actual price of gasoline paid by consumers after the tax is implemented is ________ per gallon.
A) $3.00
B) $3.75
C) $4.25
D) $5.00
Correct Answer:

Verified
Correct Answer:
Verified
Q25: Figure 5-2<br> <img src="https://d2lvgg3v3hfg70.cloudfront.net/TB4193/.jpg" alt="Figure 5-2
Q34: Parents who do not have their children
Q59: A product is considered to be excludable
Q72: Figure 5-5<br> <img src="https://d2lvgg3v3hfg70.cloudfront.net/TB4193/.jpg" alt="Figure 5-5
Q130: A free market fails when<br>A)there is government
Q134: A negative externality exists if<br>A)there are price
Q144: An important difference between the demand for
Q193: Figure 5-16<br> <img src="https://d2lvgg3v3hfg70.cloudfront.net/TB4193/.jpg" alt="Figure 5-16
Q207: Private costs<br>A)are borne by producers of a
Q252: A positive externality results when<br>A)economists are sure