Multiple Choice
Figure 5-13
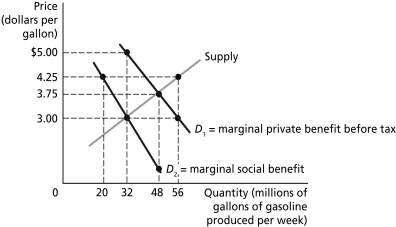
Figure 5-13 illustrates the market for gasoline before and after the government imposes a tax to bring about the efficient level of gasoline production.
-Refer to Figure 5-13.The amount of the gasoline tax is ________ per gallon.
A) $0.75
B) $1.25
C) $1.75
D) $2.00
Correct Answer:

Verified
Correct Answer:
Verified
Q88: Common resources differ from public goods in
Q121: Figure 5-13<br> <img src="https://d2lvgg3v3hfg70.cloudfront.net/TB4193/.jpg" alt="Figure 5-13
Q138: A product is considered to be nonexcludable
Q189: Which of the following conditions holds in
Q212: An external cost is created when you<br>A)graduate
Q214: When there is an externality in a
Q253: Assume that air pollution from a copper
Q257: When there is a positive externality in
Q261: Figure 5-7<br> <img src="https://d2lvgg3v3hfg70.cloudfront.net/TB4192/.jpg" alt="Figure 5-7
Q262: A market supply curve reflects the<br>A)external costs