Multiple Choice
Figure 9-3
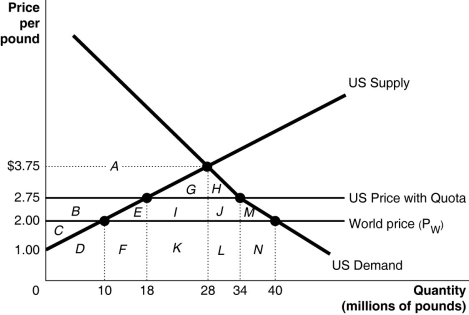
Since 1953 the United States has imposed a quota to limit the imports of peanuts. Figure 9-3 illustrates the impact of the quota.
-Refer to Figure 9-3.What is the area that represents the deadweight loss as a result of the quota?
A) G + H
B) G + H + I + J
C) E + I + J + M
D) E + M
Correct Answer:

Verified
Correct Answer:
Verified
Q156: Disagreements about whether the U.S.government should regulate
Q157: Table 9-2<br> <img src="https://d2lvgg3v3hfg70.cloudfront.net/TB4193/.jpg" alt="Table 9-2
Q158: Figure 9-3<br> <img src="https://d2lvgg3v3hfg70.cloudfront.net/TB4193/.jpg" alt="Figure 9-3
Q159: Exports are domestically produced goods and services<br>A)sold
Q160: Distinguish between a voluntary export restraint and
Q162: Figure 9-3<br> <img src="https://d2lvgg3v3hfg70.cloudfront.net/TB4193/.jpg" alt="Figure 9-3
Q163: As a percentage of GDP, exports are
Q164: Protectionism refers to the use of trade
Q165: What is the difference between imports and
Q166: One reason for the success that firms