Figure 10-6 the Above Panels Show Various Combinations of Indifference Curves and Combinations
Multiple Choice
Figure 10-6
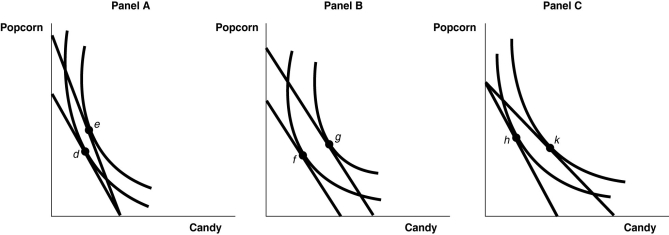
The above panels show various combinations of indifference curves and budget constraints for two products: Popcorn and Candy.
-Refer to Figure 10-6.Which diagram demonstrates a decrease in total utility following an increase in the price of candy?
A) the movement from e to d in Panel A
B) the movement from g to f in Panel B
C) the movement from k to h in Panel C
D) none of the above
Correct Answer:

Verified
Correct Answer:
Verified
Q7: The substitution effect of a decrease in
Q15: Alan Krueger conducted a survey of fans
Q29: Molly received an autographed poster of David
Q34: Describe the demand curve for a Giffen
Q68: Marginal utility is<br>A)the change in total utility
Q99: Figure 10-5<br> <img src="https://d2lvgg3v3hfg70.cloudfront.net/TB4192/.jpg" alt="Figure 10-5
Q100: Figure 10-9<br> <img src="https://d2lvgg3v3hfg70.cloudfront.net/TB4192/.jpg" alt="Figure 10-9
Q157: During its run on Broadway, the play
Q199: Health clubs typically experience an increase in
Q287: The substitution effect of an increase in