Multiple Choice
Figure 15-4
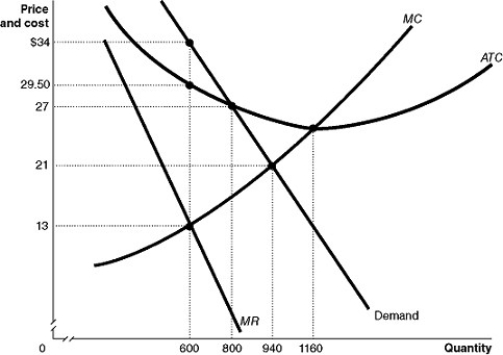
Figure 15-4 shows the demand and cost curves for a monopolist.
-Refer to Figure 15-4.What is the profit-maximizing/loss-minimizing output level?
A) 600 units
B) 800 units
C) 940 units
D) 1,160 units
Correct Answer:

Verified
Correct Answer:
Verified
Q150: A market economy benefits from market power<br>A)if
Q151: A monopoly is a firm that is
Q152: A profit-maximizing monopoly's price is<br>A)the same as
Q153: The Aluminum Company of America (Alcoa)had a
Q154: A monopoly is characterized by all of
Q156: For a natural monopoly, the marginal cost
Q157: Consider two industries, industry Q and industry
Q158: A possible advantage of a horizontal merger
Q159: Figure 15-10<br> <img src="https://d2lvgg3v3hfg70.cloudfront.net/TB4193/.jpg" alt="Figure 15-10
Q160: To maximize profit a monopolist will produce