Multiple Choice
Figure 15-12
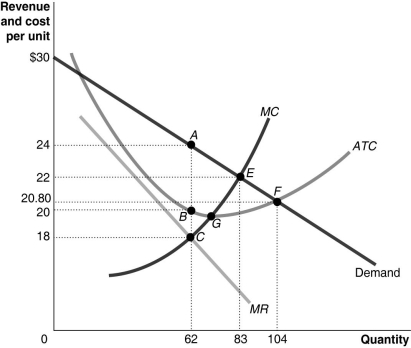
Figure 15-12 shows the cost and demand curves for a monopolist.
-Refer to Figure 15-12.Assume the firm maximizes its profits.What is the amount of consumer surplus?
A) $21
B) $124
C) $186
D) $332
Correct Answer:

Verified
Correct Answer:
Verified
Q9: What gives rise to a natural monopoly?
Q33: What is a public franchise? Are all
Q39: If a theatre company expects $250,000 in
Q59: An example of a monopoly based on
Q67: Whenever a firm can charge a price
Q79: Experience with patents in the pharmaceutical industry
Q151: Microsoft hires marketing and sales specialists to
Q152: Figure 15-4<br> <img src="https://d2lvgg3v3hfg70.cloudfront.net/TB4192/.jpg" alt="Figure 15-4
Q212: The size of a deadweight loss in
Q272: Figure 15-11<br> <img src="https://d2lvgg3v3hfg70.cloudfront.net/TB4193/.jpg" alt="Figure 15-11