Multiple Choice
In Figure 17-4,below,initial demand,marginal cost,and marginal revenue curves (none of them shown) caused the firm to produce the profit-maximizing quantity Y₀ at a price of P₀.Now the demand and marginal cost curves have moved to those shown,with the marginal revenue curve running through point L.
Figure 17-4
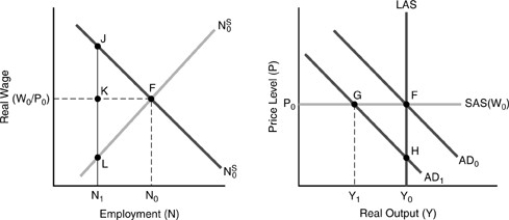
-In Figure 17-4 above,the profit-maximizing quantity,in the absence of "menu costs," ________,with profit equal to ________.
A) remains Y₀,J + K
B) remains Y₀,H + K
C) remains Y₀,G + H + J + K
D) falls to Y₁,G + J
E) falls to Y₁,F + G + J
Correct Answer:

Verified
Correct Answer:
Verified
Q37: According to the new Keynesian economists,SAS adjusts
Q38: Initially a firm pays a wage and
Q39: After a shift from AD₀ to AD₁,which
Q40: According to the real business cycle theory,the
Q41: Employing the New Keynesian concepts of "macroeconomic
Q43: According to Gordon,a major problem with Keynes'
Q44: Long-term contracts are desirable for both firms
Q45: A supply shock,such as the OPEC oil-price
Q46: Efficiency wage theory provides a reason for
Q47: Faced with a decrease in the demand