Multiple Choice
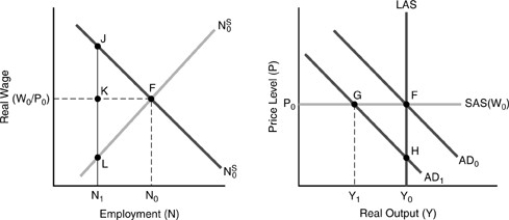
In Figure 17-4,below,initial demand,marginal cost,and marginal revenue curves (none of them shown) caused the firm to produce the profit-maximizing quantity Y₀ at a price of P₀.Now the demand and marginal cost curves have moved to those shown,with the marginal revenue curve running through point L.
Figure 17-4
-If the firm in Figure 17-4 above maintains its set price of P₀,its profit is
A) G + H.
B) G + J.
C) F + G + J.
D) G + H + J + K.
E) J + K.
Correct Answer:

Verified
Correct Answer:
Verified
Q28: A primary difference between the original and
Q29: In the fooling model's AD/SAS/LAS diagram,short-run equilibria
Q30: Suppose the AD and SAS curves shift
Q31: If all firms are paying efficiency wages
Q32: Figure 17-3<br> <img src="https://d2lvgg3v3hfg70.cloudfront.net/TB2645/.jpg" alt="Figure 17-3
Q34: A New Keynesian firm chooses<br>A)its selling price
Q35: Which of the following is an important
Q36: Switzerland has experienced the lowest rate of
Q37: According to the new Keynesian economists,SAS adjusts
Q38: Initially a firm pays a wage and