Multiple Choice
In Figure 17-4,below,initial demand,marginal cost,and marginal revenue curves (none of them shown) caused the firm to produce the profit-maximizing quantity Y₀ at a price of P₀.Now the demand and marginal cost curves have moved to those shown,with the marginal revenue curve running through point L.
Figure 17-4
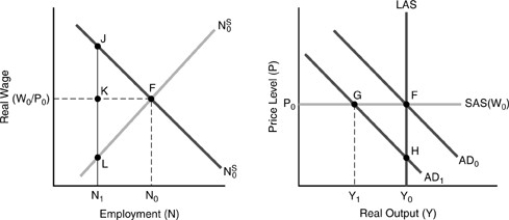
-If the firm in Figure 17-4 above maintains its set price of P₀,rather than dropping price to P₁,this reduces its profit by
A) K - G.
B) K + G.
C) G - K.
D) G + H.
E) G.
Correct Answer:

Verified
Correct Answer:
Verified
Q71: An adverse supply shock with a vertical
Q72: One clear triumph for New Classical macroeconomics
Q73: The "fooling" model was developed by economist<br>A)Milton
Q74: Suppose that nominal aggregate demand falls by
Q75: Suppose a worker signs a contract containing
Q77: Much of macroeconomic theory has been developed
Q78: A recent development in the RBC literature
Q79: The reluctance to change the relative relationships
Q80: One of the major weaknesses of the
Q81: Figure 17-3<br> <img src="https://d2lvgg3v3hfg70.cloudfront.net/TB2645/.jpg" alt="Figure 17-3