Multiple Choice
Figure 3-2
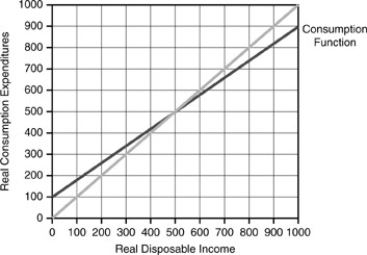
-Refer to the information above.What is the equilibrium level of GDP?
A) 600
B) 1000
C) 1500
D) 1800
Correct Answer:

Verified
Correct Answer:
Verified
Related Questions
Q49: The IS curve represents<br>A)investment and saving when
Q50: If Y is income,E is actual expenditure,Ep
Q51: An increase in autonomous taxes<br>A)increases autonomous planned
Q52: Suppose the only leakages are savings and
Q53: Figure 3-2<br> <img src="https://d2lvgg3v3hfg70.cloudfront.net/TB2645/.jpg" alt="Figure 3-2
Q55: An increase in the marginal propensity to
Q56: If Y = $200 billion,c = 0.75,autonomous
Q57: A $1 increase in autonomous spending has
Q58: In equilibrium,<br>A)income = planned expenditures.<br>B)unplanned inventory investment
Q59: One way to view equilibrium in the