Multiple Choice
Figure 3-5
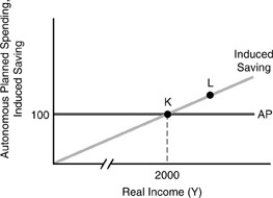
-In Figure 3-5 above,the marginal propensity to save is
A) 0.20.
B) 0.80.
C) 0.05.
D) 0.02.
Correct Answer:

Verified
Correct Answer:
Verified
Related Questions
Q151: Figure 3-7<br> <img src="https://d2lvgg3v3hfg70.cloudfront.net/TB2645/.jpg" alt="Figure 3-7
Q152: If both autonomous imports and autonomous taxes
Q153: The slope of the planned expenditure line
Q154: Higher real GDP growth usually causes<br>A)a drop
Q155: If the MPS is 0.1 and the
Q157: In economic models,variables taken as given and
Q158: The multiplier measures the<br>A)number of steps it
Q159: In 2005 real personal saving has decreased
Q160: When interest rate rise consumers will<br>A)compare loan
Q161: In the four-part diagram used to construct