Multiple Choice
Figure 3-5
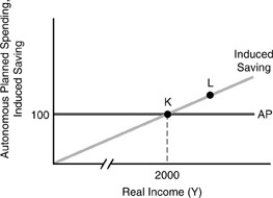
-In Figure 3-5 above,the saving function is
A) 100 + 0.8(Y -T) .
B) -100 + 0.05(Y -T) .
C) 0.2Y - 100.
D) 100 + Y - T.
Correct Answer:

Verified
Correct Answer:
Verified
Q92: During the worst of the Great Depression,in
Q93: Should autonomous consumption fall by one dollar,the
Q94: Which of the components of total planned
Q95: Saving is positive for all levels of
Q96: Equilibrium income equals planned autonomous spending<br>A)times the
Q98: Figure 3-7<br> <img src="https://d2lvgg3v3hfg70.cloudfront.net/TB2645/.jpg" alt="Figure 3-7
Q99: Since income tax revenues will rise (fall)as
Q100: Figure 3-6<br> <img src="https://d2lvgg3v3hfg70.cloudfront.net/TB2645/.jpg" alt="Figure 3-6
Q101: Following housing market collapse,U.S.personal saving rates have<br>A)increased.<br>B)decreased.<br>C)remained
Q102: Figure 3-4<br> <img src="https://d2lvgg3v3hfg70.cloudfront.net/TB2645/.jpg" alt="Figure 3-4