Multiple Choice
Figure 3-7
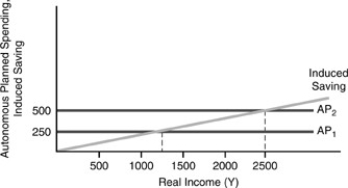
-In Figure 3-7 above,a $250 increase in AP causes
A) Y to increase by $1250.
B) induced saving to increase by $250.
C) consumption to increase by $1000.
D) all of the above.
Correct Answer:

Verified
Correct Answer:
Verified
Related Questions
Q77: A marginal propensity to save of 0.20
Q78: Figure 3-3<br> <img src="https://d2lvgg3v3hfg70.cloudfront.net/TB2645/.jpg" alt="Figure 3-3
Q79: In the consumption function C = a
Q80: Suppose that equilibrium income is 3200 and
Q81: In the saving function,autonomous saving is<br>A)-a +
Q83: Figure 3-6<br> <img src="https://d2lvgg3v3hfg70.cloudfront.net/TB2645/.jpg" alt="Figure 3-6
Q84: If the MPS is 0.1 and the
Q85: The IS curve plots for each level
Q86: In the simple Keynesian model of the
Q87: The one type of expenditure that we