Multiple Choice
Figure 8-5
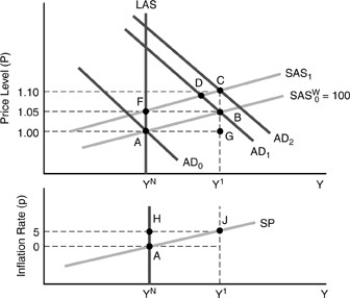
-In Figure 8-5 above,if we move from points A to B to C in the top diagram,this is translated to the bottom diagram as a move from points
A) A to J and back to A.
B) A to J.
C) A to H.
D) A to J to H.
E) A to H and back to A.
Correct Answer:

Verified
Correct Answer:
Verified
Q178: At every current AD/SAS equilibrium point to
Q179: Which of the following are reasons why
Q180: Which of the following does NOT affect
Q181: In constructing the short-run Phillips Curve,SP,<br>A)real wages
Q182: When the expected inflation rate is 5
Q184: Figure 8-6<br> <img src="https://d2lvgg3v3hfg70.cloudfront.net/TB2645/.jpg" alt="Figure 8-6
Q185: Which of the following represent supply shocks?<br>A)oil,farm
Q186: The existence of COLAs in an economy
Q187: When the actual inflation rate is equal
Q188: Suppose that an adverse supply shock causes