Multiple Choice
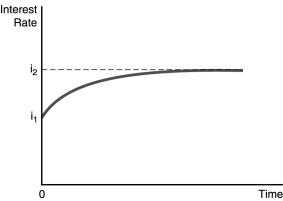
-In the figure above,illustrates the effect of an increased rate of money supply growth at time period 0.From the figure,one can conclude that the
A) liquidity effect is smaller than the expected inflation effect and interest rates adjust quickly to changes in expected inflation.
B) liquidity effect is larger than the expected inflation effect and interest rates adjust quickly to changes in expected inflation.
C) liquidity effect is larger than the expected inflation effect and interest rates adjust slowly to changes in expected inflation.
D) liquidity effect is smaller than the expected inflation effect and interest rates adjust slowly to changes in expected inflation.
Correct Answer:

Verified
Correct Answer:
Verified
Q3: The _ the returns on two securities
Q4: If the expected return on bonds increases,all
Q8: When stock prices become more volatile,the _
Q23: <img src="https://d2lvgg3v3hfg70.cloudfront.net/TB2988/.jpg" alt=" -In the figure
Q23: The riskiness of an asset is measured
Q27: Milton Friedman called the response of lower
Q81: Everything else held constant,if the expected return
Q90: The riskiness of an asset that is
Q145: Of the four factors that influence asset
Q156: If the interest rate on a bond