Multiple Choice
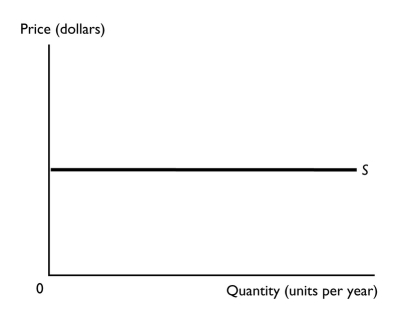
-The figure above shows the supply curve for a good with a
A) perfectly elastic supply.
B) perfectly inelastic supply.
C) elastic supply.
D) inelastic supply.
E) unit elastic supply.
Correct Answer:

Verified
Correct Answer:
Verified
Q86: The price elasticity of supply measures<br>A) the
Q112: Which is larger: The price elasticity of
Q151: <img src="https://d2lvgg3v3hfg70.cloudfront.net/TB1458/.jpg" alt=" -Using the data
Q182: List factors that increase the price elasticity
Q191: Joe receives a 20 percent increase in
Q207: People eat at restaurants less often when
Q231: <img src="https://d2lvgg3v3hfg70.cloudfront.net/TB1458/.jpg" alt=" -In the figure
Q244: Moving downward along a linear (straight-line)downward-sloping demand
Q254: Using the midpoint method,if the price of
Q432: A 10 percent increase in income brings