Multiple Choice
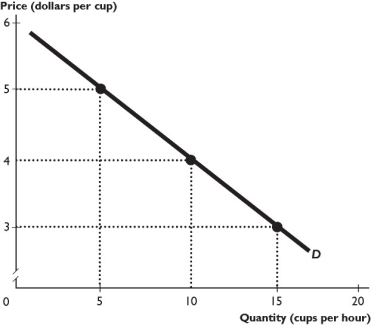
The figure above shows the demand curve for Starbucks latte.
-In in the figure above,when the price falls from $5 to $4,the price elasticity of demand is
A) 2.
B) 3.
C) 0.75.
D) 1.5.
E) 0.33.
Correct Answer:

Verified
Correct Answer:
Verified
Related Questions
Q12: Suppose the current price of barley is
Q34: Many manufactured goods have an _ supply
Q69: Pete feeds his dog 100 percent more
Q110: Demand is elastic if<br>A) consumers respond strongly
Q119: Which of the following is correct?<br>i.All linear
Q197: When the price of a burrito increases
Q268: If a 2 percent change in price
Q286: If the quantity supplied and the price
Q333: When two goods are related such that
Q456: If a decrease in price increases total