Multiple Choice
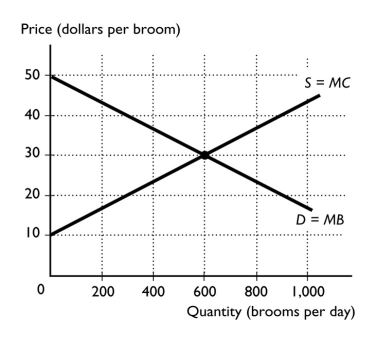
-The figure above shows the market for brooms.If the market is efficient,
A) 0 brooms are produced.
B) 600 brooms are produced.
C) more than 1000 brooms are produced.
D) between 0 and 600 brooms are produced.
E) between 600 and 1000 brooms are produced.
Correct Answer:

Verified
Correct Answer:
Verified
Related Questions
Q71: If the government imposes a tax on
Q72: When people cannot be excluded from consuming
Q73: Which describes the economic meanings of value
Q75: John has a marginal benefit of $7
Q77: What did Adam Smith identify as the
Q79: In a figure,the consumer surplus is equal
Q80: A point on the supply curve can
Q81: Resource use is allocative efficient<br>A) when it
Q206: What is the "big tradeoff"?
Q264: "A demand curve is the same as