Multiple Choice
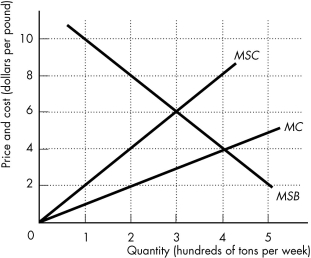
-The above figure shows the marginal private cost curve,marginal social cost curve,and marginal social benefit curve for cod,a common resource.The market equilibrium with no government intervention is ________.
A) 0 tons per week
B) 200 tons per week
C) 400 tons per week
D) 500 tons per week
E) None of the above answers is correct.
Correct Answer:

Verified
Correct Answer:
Verified
Q106: One reason the size of the government
Q107: If a good or resource is rival,it
Q108: The principle of minimum differentiation describes a
Q109: Marginal cost curves for public goods are
Q110: Suppose a public good is provided in
Q113: A private,competitive market<br>A) provides the efficient quantity
Q114: One way to overcome the tragedy of
Q115: The free-rider problem is associated with<br>A) public
Q116: When Jean makes a decision NOT to
Q395: Why are fish in the ocean an