Essay
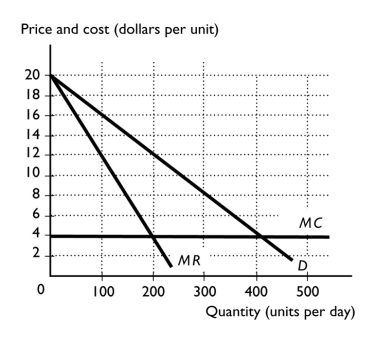
-The figure above shows a the market demand curve for a market with three firms.It also shows a firm's marginal cost curve.In this oligopoly,what is the range of output and prices? Why does this range of outcomes exist?
Correct Answer:

Verified
If the firms operate as a monopoly,they ...View Answer
Unlock this answer now
Get Access to more Verified Answers free of charge
Correct Answer:
Verified
View Answer
Unlock this answer now
Get Access to more Verified Answers free of charge
Q62: What is the best outcome for society:
Q89: _ is an agreement between a manufacturer
Q122: If the HHI for an industry equals
Q123: According to Section 2 of the Sherman
Q133: Which of the following statements is correct?<br>A)
Q152: Suppose two companies,Sony and Magnavox,are competing in
Q153: <img src="https://d2lvgg3v3hfg70.cloudfront.net/TB1456/.jpg" alt=" The figure
Q177: One way to identify oligopoly is to<br>A)
Q180: In the above figure,the output of an
Q224: <img src="https://d2lvgg3v3hfg70.cloudfront.net/TB1458/.jpg" alt=" -Suppose Intel and