Multiple Choice
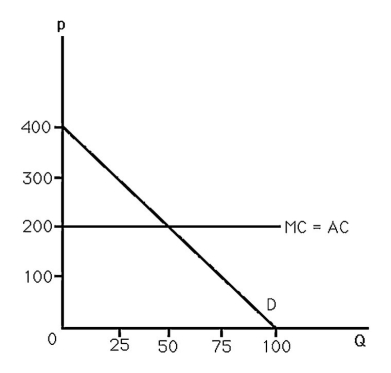
-The above figure shows the demand and cost curves facing a monopoly.If a $100 per unit tax is charged,the loss in welfare resulting from the tax is
A) $250.
B) $312.50.
C) $1,250.
D) $1,562.50.
Correct Answer:

Verified
Correct Answer:
Verified
Q69: <img src="https://d2lvgg3v3hfg70.cloudfront.net/TB6808/.jpg" alt=" -The above figure
Q70: If the government regulates a natural monopoly
Q71: The monopolist's marginal revenue curve<br>A) doesn't exist.<br>B)
Q72: An alternative to patent protection might be<br>A)
Q73: <img src="https://d2lvgg3v3hfg70.cloudfront.net/TB6808/.jpg" alt=" -The above figure
Q75: A monopoly's output decision depends only on
Q76: If the government desires to raise a
Q77: Humana Hospital's price/marginal cost ratio of 2.3
Q78: <img src="https://d2lvgg3v3hfg70.cloudfront.net/TB6808/.jpg" alt=" -The above figure
Q79: If a monopoly's demand curve shifts to