Multiple Choice
Use the figure below to answer the following questions.
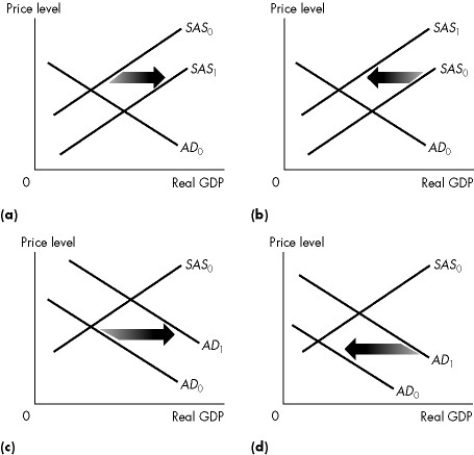
Figure 26.2.1
-Refer to Figure 26.2.1.Which graph illustrates what happens when government expenditure increases?
A) (a)
B) (b)
C) (c)
D) (d)
E) None of the above
Correct Answer:

Verified
Correct Answer:
Verified
Related Questions
Q17: Which of the following news quotes best
Q17: The defining feature of the Keynesian view
Q34: We observe an increase in the price
Q54: A recessionary gap is the amount by
Q63: Use the figure below to answer the
Q72: Use the figure below to answer the
Q79: Use the figure below to answer the
Q110: Use the figure below to answer the
Q123: Everything else remaining the same, an increase
Q135: Use the figure below to answer the