Multiple Choice
Use the figure below to answer the following questions.
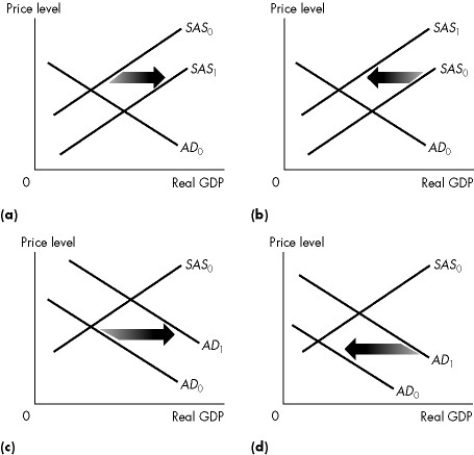
Figure 26.2.1
-Refer to Figure 26.2.1.Which graph illustrates what happens when government expenditure decreases?
A) (a)
B) (b)
C) (c)
D) (d)
E) (a) and (b)
Correct Answer:

Verified
Correct Answer:
Verified
Related Questions
Q30: The aggregate demand curve is a relationship
Q32: An increase in the money wage rate
Q36: Use the figure below to answer the
Q40: Use the figure below to answer the
Q43: Everything else remaining the same, an increase
Q56: If factor prices remain constant, an increase
Q70: The quantity of real GDP demanded is
Q78: Use the table below to answer the
Q105: Use the figure below to answer the
Q119: Your total wealth is $1,000, which you