Multiple Choice
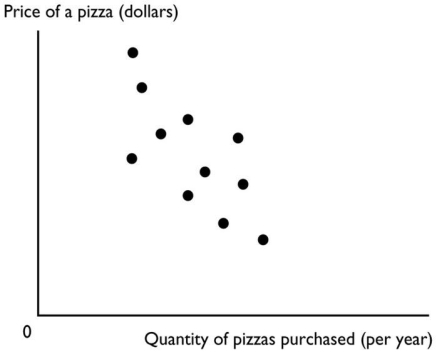
The figure above shows a
A) slope.
B) time-series graph.
C) cross-section graph.
D) scatter diagram.
E) trend diagram.
Correct Answer:

Verified
Correct Answer:
Verified
Related Questions
Q170: Australia has a universal health care system
Q171: A graph shows the average ATAR scores
Q172: The benefit of an activity is<br>A)purely objective
Q173: In examining two variables,we find that as
Q174: Ali decides to attend the one-hour review
Q176: Scarcity means we must<br>A)work more.<br>B)make choices.<br>C)earn more.<br>D)consume
Q177: A normative statement<br>A)must be tested to determine
Q178: The value of the best thing that
Q179: <img src="https://d2lvgg3v3hfg70.cloudfront.net/TB1012/.jpg" alt=" -To graph a
Q180: A positive statement<br>A)must always be right.<br>B)cannot be