Multiple Choice
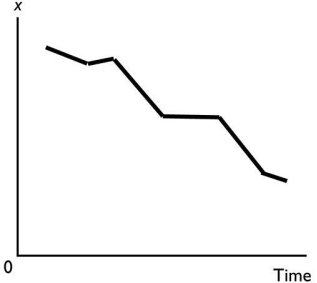
In the above figure,the diagram shows
A) a scatter diagram.
B) a two-variable scatter diagram.
C) a downward trend in x.
D) an upward trend in x.
E) a cross-section graph between x and time.
Correct Answer:

Verified
Correct Answer:
Verified
Q110: Scarcity forces people to<br>A)be unwilling to help
Q111: Scarcity results from the fact that<br>A)choices made
Q112: Mothers Against Drunk Drivers (MADD)campaigned to increase
Q113: An incentive is<br>A)when people make rational choices
Q114: <img src="https://d2lvgg3v3hfg70.cloudfront.net/TB1012/.jpg" alt=" The graph shows
Q116: Which of the following is an example
Q117: Suppose you take a trip during the
Q118: Normative statements i.describe how the world is.<br>Ii)describe
Q119: As part of its proposal to win
Q120: Which of the following is a macroeconomic