Multiple Choice
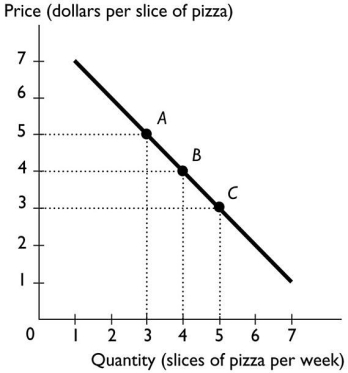
-The above figure shows the relationship between the price of a slice of pizza and how many slices of pizza Ricardo buys in a week.Between points A and B,the slope of the line equals
A) -4.
B) -1.
C) -3.
D) -2
E) -5.
Correct Answer:

Verified
Correct Answer:
Verified
Q125: Which of the following is a normative
Q127: The slope<br>A)equals the change in the value
Q128: Your lecturer changes the penalty for cheating
Q129: Which of the following BEST describes macroeconomics?<br>A)It
Q131: Which of the following is the best
Q132: All economic questions and problems arise from<br>A)the
Q133: If x increases and as a result
Q134: Which of the following is a microeconomic
Q135: A time-series graph measures<br>A)the value of one
Q138: <img src="https://d2lvgg3v3hfg70.cloudfront.net/TB1458/.jpg" alt=" -In the above