Multiple Choice
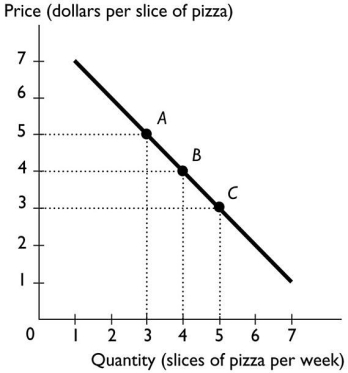
-The above figure shows the relationship between the price of a slice of pizza and how many slices of pizza Ricardo buys in a week.Between points A and B,the slope of the line is ________ the slope of the line between points B and C.
A) greater than
B) equal to
C) less than
D) not comparable to
E) unrelated to
Correct Answer:

Verified
Correct Answer:
Verified
Q104: Most economic graphs have two lines perpendicular
Q105: If a decision is made and it
Q107: <img src="https://d2lvgg3v3hfg70.cloudfront.net/TB1012/.jpg" alt=" -In the diagram
Q108: A time-series graph reveals whether there _,which
Q110: Scarcity forces people to<br>A)be unwilling to help
Q111: Scarcity results from the fact that<br>A)choices made
Q112: Mothers Against Drunk Drivers (MADD)campaigned to increase
Q113: An incentive is<br>A)when people make rational choices
Q114: <img src="https://d2lvgg3v3hfg70.cloudfront.net/TB1012/.jpg" alt=" The graph shows
Q347: <img src="https://d2lvgg3v3hfg70.cloudfront.net/TB1454/.jpg" alt=" -Two variables are