Multiple Choice
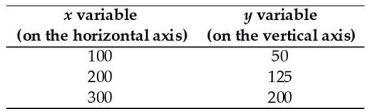
The table above shows data on two variables.If these data were graphed,the slope of the line would be
A) 1/2.
B) 2.
C) 2/3.
D) 4/3.
E) 3/4.
Correct Answer:

Verified
Correct Answer:
Verified
Related Questions
Q64: <img src="https://d2lvgg3v3hfg70.cloudfront.net/TB1012/.jpg" alt=" The slope of
Q65: The additional benefit of increasing some activity
Q66: Macroeconomics is the study of<br>A)the government.<br>B)how ceteris
Q67: Matt pays a $50 a month membership
Q68: Which of the following is a topic
Q70: Economists measure opportunity cost<br>A)as the sum of
Q71: A curve with a positive but decreasing
Q72: To show the values of an economic
Q73: The primary focus of microeconomics is<br>A)our government's
Q143: The minimum point of a U-shaped curve,<br>A)