Multiple Choice
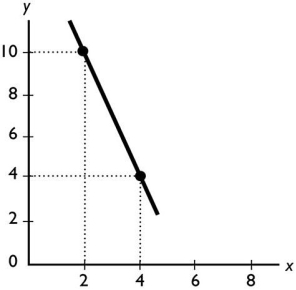
The slope of the line shown in the above figure is
A) -3.
B) -10.
C) -1.
D) -5.
E) -1/3.
Correct Answer:

Verified
Correct Answer:
Verified
Related Questions
Q151: A graph shows the average wage of
Q152: Most economic graphs have two lines perpendicular
Q153: 'Lower ticket prices would lead to more
Q154: A graph of the value of one
Q155: A time-series graph displays the price of
Q157: <img src="https://d2lvgg3v3hfg70.cloudfront.net/TB1012/.jpg" alt=" The graph shows
Q158: Which of the following is an example
Q159: You have data for the amount of
Q160: In a graph,a straight line has a
Q161: A graph showing the values of an