Multiple Choice
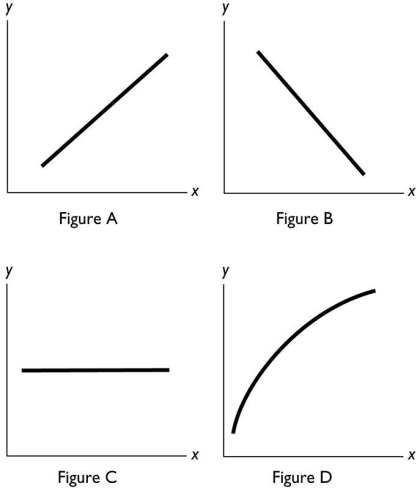
-In the above figure,which of the figures show a relationship between x and y with a negative slope?
A) Figure A
B) Figure B
C) Figure C
D) Figure D
E) Both Figure A and Figure B
Correct Answer:

Verified
Correct Answer:
Verified
Q39: A cross-section graph<br>A)measures time on the x-axis
Q40: An incentive is<br>A)the marginal cost of some
Q41: When unskilled teens earn less than university
Q42: <img src="https://d2lvgg3v3hfg70.cloudfront.net/TB1012/.jpg" alt=" The slope of
Q43: An independent relationship between two variables is
Q45: <img src="https://d2lvgg3v3hfg70.cloudfront.net/TB1012/.jpg" alt=" -In the figure
Q46: As a person increases his or her
Q47: When an electricity distribution company decides to
Q48: Whenever one variable increases,another variable decreases.The two
Q49: If the marginal benefit of getting a