Multiple Choice
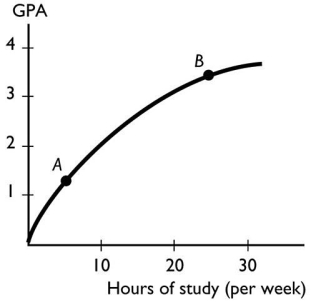
-The figure above shows the relationship between the time a student spends studying and the student's GPA that semester.This figure shows ________ relationship between the time spent studying and the GPA.
A) a positive,linear
B) cross-sectionally trended
C) no
D) a negative
E) a positive but not linear
Correct Answer:

Verified
Correct Answer:
Verified
Q182: When people make rational choices,they<br>A)necessarily make a
Q183: In order to determine whether to major
Q184: Microeconomics includes the study of the<br>A)choices made
Q185: The benefit of a one-unit increase in
Q186: The slope of a line equals the
Q188: A graph shows that the number of
Q189: If,whenever one variable increases,another variable also increases,then
Q190: Scarcity means that<br>A)what we can produce with
Q191: Three variables are related and two of
Q192: A rational choice is one that<br>A)is made