Multiple Choice
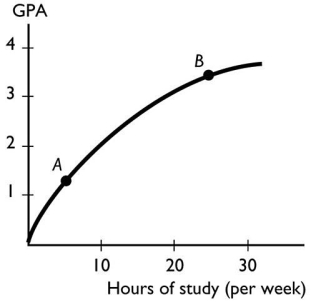
-The figure above shows the relationship between the time a student spends studying and the student's GPA that semester.The slope of the relationship at point A ________ the slope at point B.
A) is equal to
B) cannot be compared to
C) is greater than
D) is less than
E) can be compared but more information is needed to determine whether the slope is greater than,less than or equal to
Correct Answer:

Verified
Correct Answer:
Verified
Q215: <img src="https://d2lvgg3v3hfg70.cloudfront.net/TB1012/.jpg" alt=" -Moving rightward along
Q216: In order to make a rational choice,people
Q217: Which of the following is a macroeconomic
Q218: Whether a company produces fishing rods mostly
Q219: <img src="https://d2lvgg3v3hfg70.cloudfront.net/TB1012/.jpg" alt=" -In the figure
Q221: To make a rational choice,a person<br>A)adds the
Q222: Economics is best defined as the social
Q223: Increasing income tax rates will solve the
Q224: <img src="https://d2lvgg3v3hfg70.cloudfront.net/TB1012/.jpg" alt=" -The above figure
Q225: To show how a variable _,we typically