Multiple Choice
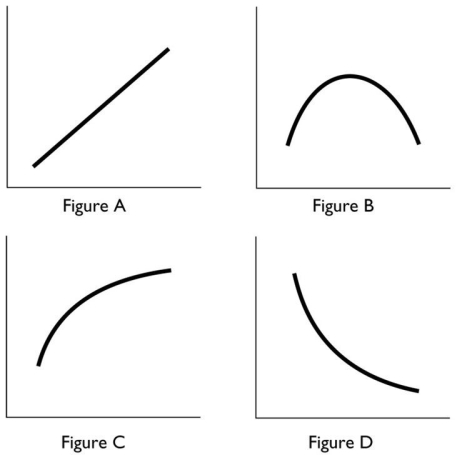
-In the above,which figures show a relationship between the variables that is always positive?
A) Figures A and B
B) Figures C and D
C) Figures A,C and D
D) Figures A and C
E) Figure A only
Correct Answer:

Verified
Correct Answer:
Verified
Q63: Which of the following statements is correct?<br>A)
Q227: The statement that 'increases in the tax
Q228: The opportunity cost of a decision is
Q229: People must make choices because<br>A)most people enjoy
Q230: A positive statement i.makes a statement about
Q231: When Toyota decides to increase production of
Q233: Which of the following is a microeconomic
Q234: A time-series graph<br>A)depicts a series of good
Q236: <img src="https://d2lvgg3v3hfg70.cloudfront.net/TB1012/.jpg" alt=" -In the above
Q237: Which of the following statements is the