Multiple Choice
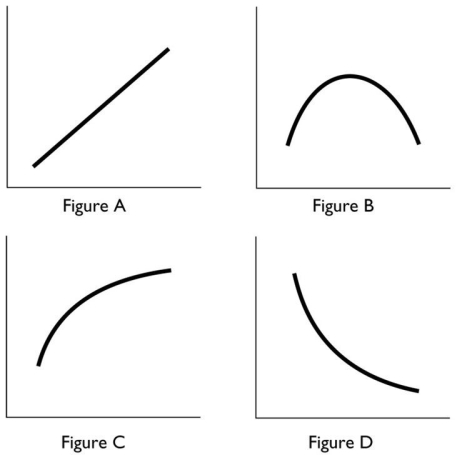
-In the above,which figures show a relationship between the variables that is always negative?
A) Figure D only
B) Figures A,C and D
C) Figure B only
D) Figure A only
E) Figures A and C
Correct Answer:

Verified
Correct Answer:
Verified
Related Questions
Q160: In a graph,a straight line has a
Q161: A graph showing the values of an
Q162: <img src="https://d2lvgg3v3hfg70.cloudfront.net/TB1012/.jpg" alt=" -In the diagram
Q163: A graph shows the wage rate of
Q164: Which of the following is a microeconomic
Q166: When Ferrari decides to produce 1,200 '360
Q167: A scatter diagram can be used to
Q168: Proponents of cuts to income tax rates
Q169: Demonstrating how an economic variable changes from
Q170: Australia has a universal health care system