Multiple Choice
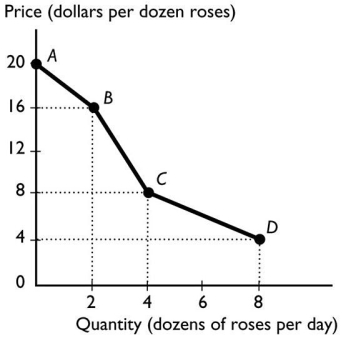
-The figure above shows the relationship between the price of a dozen roses and the quantity of roses a florist can sell.The slope between points A and B is
A) 20.
B) 16.
C) 4.
D) 2.
E) non-existent because at point A no roses are sold.
Correct Answer:

Verified
Correct Answer:
Verified
Related Questions
Q10: Consider a diagram in which the variable
Q11: John has two hours of free time
Q12: When a landscaping company decides to use
Q13: Which of the following is an example
Q14: Scarcity requires that we<br>A)learn to limit our
Q16: _ shows the values of a variable
Q17: <img src="https://d2lvgg3v3hfg70.cloudfront.net/TB1012/.jpg" alt=" -In the diagram
Q18: Which of the following is a macroeconomic
Q19: Choices that are best for the society
Q20: A slope is measured as the<br>A)value of