Multiple Choice
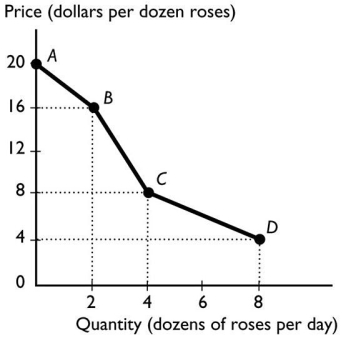
-The figure above shows the relationship between the price of a dozen roses and the quantity of roses a florist can sell.The slope between points C and D equals
A) 1.
B) 4.
C) 12.
D) 2.
E) 8.
Correct Answer:

Verified
Correct Answer:
Verified
Related Questions
Q132: All economic questions and problems arise from<br>A)the
Q133: If x increases and as a result
Q134: Which of the following is a microeconomic
Q135: A time-series graph measures<br>A)the value of one
Q136: When two variables in a graph are
Q138: A slope is measured as the<br>A)value of
Q139: Because human wants are insatiable and unlimited
Q140: An economist observed that,as more computers are
Q141: <img src="https://d2lvgg3v3hfg70.cloudfront.net/TB1012/.jpg" alt=" In the above
Q142: Matthew has eaten two hamburgers and is