Multiple Choice
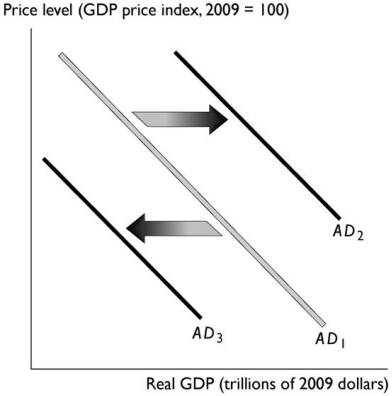
-In the figure above,the shift in the aggregate demand curve from AD₁ to AD₂ could be the result of
A) a fall in the price level.
B) a rise in the price level.
C) a decrease in the quantity of money.
D) an increase in government expenditures on goods and services.
E) an increase in taxes.
Correct Answer:

Verified
Correct Answer:
Verified
Q3: An increase in government expenditure on goods
Q23: An economy experiences a recessionary gap. As
Q60: Stagflation is defined as a period when
Q62: Along the aggregate supply curve, the quantity
Q76: In its macroeconomic equilibrium, the economy can
Q142: The government passes a law which doubles
Q144: The quantity of real GDP supplied _
Q145: The slope of the aggregate supply curve
Q148: If people's expectations about future income improve
Q152: <img src="https://d2lvgg3v3hfg70.cloudfront.net/TB1012/.jpg" alt=" The table