Multiple Choice
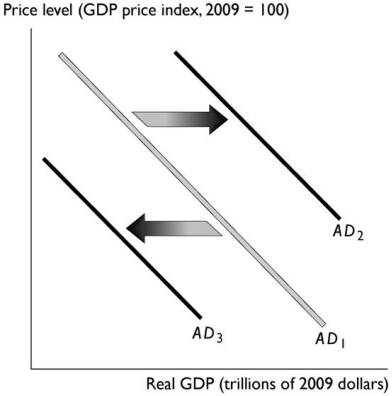
-In the figure above,the shift in the aggregate demand curve from AD₁ to AD₃ could be the result of
A) a fall in the price level.
B) a tax cut.
C) an increased expectation of a recession that lowers people's expected future incomes.
D) a rise in the price level.
E) a decrease in the foreign exchange rate.
Correct Answer:

Verified
Correct Answer:
Verified
Q17: Demand-pull inflation starts with<br>A)an increase in aggregate
Q18: When the price level rises and the
Q20: A fall in the price level brings
Q22: If the costs of production decrease,there is<br>A)an
Q23: In the short run,a rise in the
Q32: If the price level falls and the
Q40: If investment spending increases by $1 million,
Q61: The aggregate demand multiplier effect says that
Q66: The aggregate supply curve shifts rightward when<br>A)
Q80: At a peak in the business cycle,